Showing posts with label genetics. Show all posts

Sunday, April 22, 2012

R2 frequency in Afghanistan

Source


Afghanistan (190 samples)
R2* - 0.5%
R2a - 4.2%

Afghanistan(North)(44 samples)
R2* - nil
R2a - 11.4%

Afghanistan(South)(146 samples)
R2* - 0.7%
R2a - 2.1%

Sunday, September 12, 2010

ISOGG 2010 Y-DNA Haplogroup R

ISOGG 2010 Y-DNA Haplogroup R (link)
(click to enlarge)

It's now official, all R-M124 (previously R2) are now R2a.
• R2 M479
• • R2* -
• • R2a L266, M124, P249, P267

Monday, June 28, 2010

Facts and Common Misconceptions

  • No, haplogroups are not the same as haplotypes.
  • Yes, all people living today fall into one of 18 main Y-DNA haplogroups on their paternal line, and one of 26 main mtDNA haplogroups on their maternal line.
  • No, haplogroups will not show if you are related to someone (unless you count distant relationships from thousands of years ago).
  • Yes, once you know your haplogroup, you will be able to view how your haplogroup migrated out of Africa and retrace their migration routes.
  • No, haplogroups will not add people to your family tree or allow you to trace your surname (that’s the job of STR haplotypes).
  • No, haplogroups will not tell you precise migration routes, it will show a broad migration route and population distribution.
  • No, if you and someone else belong to the same haplogroup, it does not mean that you are closely related.
  • Yes, once you know your haplogroup, you can often fine tune your branch of the haplogroup tree through subclade testing.
  • No, you cannot confirm your haplogroup through STR testing or HVR1 testing.  A Y-DNA STR test and HVR1 test will often allow you to predict your haplogroup, but only a SNP backbone test will confirm the prediction.
  • No, SNP backbone testing will not give you information about sub-clades.  It will confirm your haplogroup.  Once your haplogroup has been confirmed, a subclade panel test for your particular haplogroup will trace your subclade. 
  • Yes, STR testing can give predictions for haplogroups and even some sub-clades, but the backbone test can only confirm the haplogroup, not the sub-clade.
  • Yes, subclades are determined through SNP subclade testing (once your haplogroup has been confirmed)
  • No, your haplogroup will not tell you if you are Welsh or Irish.  It will not tell you your ethnicity.  Although there are associations between ethnic groups and haplogroups, you must remember that haplogroups represent deep ancestry, tracing events from tens of thousands of years ago.  It does not tell you what your ancestors have been up to over the last few hundred years (that’s the job of Y-DNA STR markers, and applications such as Surname Projects, which will be the topic of another blog). 
  • Yes, all people living in the world today are connected in the human phylogenetic tree.  Just like how all people belong to a certain blood group i.e. A, B, AB, O which can be determined through testing, all people also belong to a certain haplogroup which is unique to their ancestry, and their haplogroup type can be determined through genetic genealogy testing. 
From Genebase.com

    Tuesday, February 23, 2010

    Phylogenetic tree of human Y-chromosome haplogroups observed in Eurasians

     
    click to enlarge
    A couple of things I notice on the chart:
    1. R2 is shown as younger than R1/R1a/R1b, which I think is probably true.
    2. An Asian source for all Europeans - excluding haplogroup E.
    link

      The Human Genetic History of South Asia

      Partha P. Majumder

      Summary:

      South Asia — comprising India, Pakistan, countries in the sub-Himalayan region and Myanmar — was one of the first geographical regions to have been peopled by modern humans. This region has served as a major route of dispersal to other geographical regions, including southeast Asia. The Indian society comprises tribal, ranked caste, and other populations that are largely endogamous. As a result of evolutionary antiquity and endogamy, populations of India show high genetic differentiation and extensive structuring. Linguistic differences of populations provide the best explanation of genetic differences observed in this region of the world. Within India, consistent with social history, extant populations inhabiting northern regions show closer affinities with Indo-European speaking populations of central Asia that those inhabiting southern regions. Extant southern Indian populations may have been derived from early colonizers arriving from Africa along the southern exit route. The higher-ranked caste populations, who were the torch-bearers of Hindu rituals, show closer affinities with central Asian, Indo-European speaking, populations.

      Current Biology, Volume 20, Issue 4, R184-R187, 23 February 2010
      Full article (link)

      Sunday, February 14, 2010

      Haplogroup R2 - Highlights from various studies

      • The most frequent haplogroups among the Indian upper castes belonged to R subclades (R*, R1 and R2) and that among the lower castes and tribal populations to haplogroup H and the distribution pattern of the major Y-lineages was observed to be similar in tribal and lower caste populations, and distinct from the upper castes thereby suggesting a tribal origin for the Indian lower castes, unaffected by geography.
      • The presence of west/central Asian lineages (J2, R1 and R2) and its higher STR diversity in most of the tribes suggested its presence in India much before the arrival of Indo-European pastoralists.
      • With regard to the caste populations, a South Asian origin for the Indian caste communities with minimal Central Asian influence was proposed based on the absence of certain haplogroups in Indian samples (C3, DE, J*, I, G, N and O) which covers almost half of the Central Asian Y- chromosomes and the presence of some haplogroups in Indian Y-chromosomes (C*, F*, H, L and R2) that is poor in Central Asia.
      • The claims for the association of haplogroups J2, L, R1a and R2 with the origin of majority of the caste’s paternal lineage from outside India, was rejected.
      • Indians showed the presence of diverse lineages of three major Eurasian Y-chromosomal haplogroups, C, F and K and the exclusive presence of several subclusters of F and K (H, L, R2 and F*) in the Indian subcontinent (especially H, L and R2) was consistent with the scenario that the southern route migration from Africa carried the ancestral Eurasian lineages to the Indian subcontinent.
      • Our analysis revealed that haplogroup R2 characterizes 13.5% of the Indian Y-chromosomes and its frequency among Dravidian speakers was comparable to that of haplogroup H (20.9%) and significantly different from Indo-European and Austro-Asiatic speakers (?2= 16.2, d=3, p<0.05). While the distribution across various geographic regions was almost uniform, significant differentiation was observed along the social groups (?2= 18.7, d=3, p<0.05); a decreasing gradient was discernible as one moved up the caste hierarchy. Although tribes contributed only 7.4% of the total R2 lineage, it was proportionately distributed between the Austro-Asiatic and Dravidian tribes. Extensive analysis of its distribution between north and south Indian populations showed that while there was marginal difference among middle and lower caste groups of north India (17.1 and 17.4 % respectively), a clear gradient was observed among south Indians, where the frequency declined by more than one-half from lower to upper caste groups. Analysis of 20-Y-STRs within the R2 lineage revealed that three haplotypes were shared; one between Kamma Chaudhary and Kappu Naidu, both lower caste Dravidian speakers from Andhra Pradesh and two within Karmali and Pallar populations.
      • Four haplogroups; H= 23%; R1a1=17.5%; O2a=15% and R2=13.5%, form major paternal lineage of Indians and together account for ~70% of their Y-chromosomes.
      • The observed high frequency of R2 Y-chromosomes in Indians, which is equivalent to that of haplogroup H among Dravidian speakers, corroborates previous reports suggesting its Indian origin (Cordaux et al., 2004). The deep coalescence time for R2 lineages, dating back to Late Pleistocene, supports its indigenous origin. Outside India, it is found in Iran and Central Asia (3.3%) and among Roma Gypsies of Europe, known to have historical evidence of their migration from India (Wells et al., 2001). Within India, while it is predominant in both eastern and southern regions, its distribution pattern is rather patchy in east (Sahoo et al., 2006). It is most likely that genetic drift or bottleneck has reduced the paternal diversity of Karmali, which contributes 28% of the eastern R2 lineages. This population although considered to be Austro-Asiatic speak- er, does not present any evidence of O2a Y- chromosome lineage, portraying a distinctly different history.
      • Further, deeper coalescence age for the Y-chromosome haplogroups C, H, R2 compared to O2a is consistent with hypothesis that Austro-Asiatic speakers cannot be considered as the earliest settlers of South Asia.
      • Based on deep coalescence age estimates of H, R2 and C Y-chromosome lineages, their diversity and distribution pattern, our data suggests an early Pleistocene settlement of South Asia by Dravidian speaking south Indian populations; the Austro-Asiatic speakers migrated much later from SE Asia and probably contributed only paternal lineages while amalgamating with the aboriginal populations of the region.
      High Resolution Phylogeographic Map of Y-Chromosomes Reveal the Genetic Signatures of Pleistocene Origin of Indian Populations
      R. Trivedi, Sanghamitra Sahoo, Anamika Singh, G. Hima Bindu, Jheelam Banerjee, Manuj Tandon, Sonali Gaikwad, Revathi Rajkumar, T Sitalaximi, Richa Ashma, G. B. N. Chainy and V. K. Kashyap
      • The high frequency and STR diversity of haplogroup R2 in Indians corroborates its Indian origin.
      • It has also been reported in Iran and Central Asia with marginal frequency, which more likely suggests a recent migration from India. It is present at high frequency (53%) among Gypsies of Uzbekistan, known to have historically migrated out from India. Interestingly, this haplogroup is absent or infrequent among Gypsies of Europe whose predominant Y chromosome haplogroup is H.
      • “The proposition that a high frequency of R1a in India is caused by admixture with populations of Central Asian origin is difficult to substantiate, as the proposed source region does not meet the expectation of containing high frequencies of the other components of haplogroup R, with no examples of R* and generally low incidence of R2, which, unlike J2, does not show evidence of a recent diffusion throughout India from the northwest.  The distribution of  R2, with its concentration in Eastern and Southern India, is not consistent with a recent demographic movement from the northwest. Instead, its prevalence among castes in these regions might   represent a recent population expansion, perhaps associated with the transition to agriculture, which may have occurred independently in South Asia.”
      • Departing from the ‘‘one haplogroup equals one migration’’ scenario, Cordaux et al. defined, heuristically, a package of haplogroups (J2, R1a, R2, and L) to be associated with the migration of IE people and the introduction of the caste system to India, again from Central Asia, because they had been observed at significantly lower proportions in South Indian tribal groups, with the high frequency of R1a among Chenchus of Andhra Pradesh considered as an aberrant phenomenon. Conversely, haplogroups H, F*, and O2a, which were observed at significantly higher proportions among tribal groups of South India, led the same authors to single them out as having an indigenous Indian origin.
      Gyaneshwer Chaubey et al., “Peopling of South Asia: investigating the caste-tribe continuum in India,” BioEssays 29, no. 1 (2007): 91-100. 
      • Similarly, the proposition that a high frequency of R1a in India is caused by admixture with populations of Central Asian origin is difficult to substantiate, as the proposed source region does not meet the expectation of containing high frequencies of the other components of haplogroup R, with no examples of R* and generally low incidence of R2, which, unlike J2, does not show evidence of a recent diffusion throughout India from the north- west.
      • Second, it is notable that the results from the ADMIX2 program gave relatively high reciprocal admixture (0.3–0.35) proportions for Northwest Indian and Central Asian populations, despite the incompatibility of the respective haplogroup frequency pools; our Northwest Indian sample totally lacks haplogroups C3, DE, J*, I, G, N, and O, which cover almost half of the Central Asian Y chromosomes, whereas the Central Asian sample is poor in haplogroups C*, F*, H, L, and R2 (with a combined frequency of 10%). Hence, the admixture proportions are driven solely by the shared high frequency of R1a. In other words, if the source of R1a variation in India comes from Central Asia, as claimed by Wells et al. and Cordaux et al., then, under a recent gene flow scenario, one would expect to find the other Central Asian-derived NRY haplogroups (C3, DE, J*, I, G, N, O) in Northwest India at similarly elevated frequencies, but that is not the case.
      • Alternatively, although the simple admixture scenario does not hold, one could nevertheless argue that the other haplogroups were lost during a hypothetical bottleneck (lineage sorting among the early Indo-Aryans arriving to India). But in line with this scenario, one should expect to observe dramatically lower genetic variation among Indian R1a lineages. In fact, the opposite is true: the STR haplotype diversity on the background of R1a in Central Asia (and also in Eastern Europe) has already been shown to be lower than that in India. Rather, the high incidence of R1* and R1a throughout Central Asian and East European populations (without R2 and R* in most cases) is more parsimoniously explained by gene flow in the opposite direction, possibly with an early founder effect in South or West Asia.
      • Rather, taken together with the evidence from Fst values, the elements discussed so far (i.e., admixture, factor analysis, and frequency distributions) are more parsimoniously explained by a predominantly pre-IE, pre-Neolithic presence in India, for the majority of those Y lineages considered here (R1a, R2, L1), which occur together with strictly Indian-specific haplogroups and paragroups (C*, F*, H) among both caste and tribal groups. The distribution of R2, with its concentration in Eastern and Southern India, is not consistent with a recent demographic movement from the northwest. Instead, its prevalence among castes in these regions might represent a recent population expansion, perhaps associated with the transition to agriculture, which may have occurred independently in South Asia (23). A pre-Neolithic chronology for the origins of Indian Y chromo- somes is also supported by the lack of a clear delineation between DR and IE speakers. Again, although appeals to language change are plausible for explaining the appearance of supposedly tribe-specific Y lineages among incoming IE speakers, it is much harder to conceive of a systematic movement of external Y- chromosome types in the opposite direction, via the uptake of DR languages. The near absence of L lineages within the IE speakers from Bihar (0%), Orissa (0%), and West Bengal (1.5%) further suggests that the current distribution of Y haplogroups in India is associated primarily with geographic rather than linguistic or cultural determinants.
      • It is not necessary, based on the current evidence, to look beyond South Asia for the origins of the paternal heritage of the majority of Indians at the time of the onset of settled agriculture. The perennial concept of people, language, and agriculture arriving to India together through the northwest corridor does not hold up to close scrutiny. Recent claims for a linkage of haplogroups J2, L, R1a, and R2 with a contemporaneous origin for the majority of the Indian castes’ paternal lineages from outside the subcontinent are rejected, although our findings do support a local origin of haplogroups F* and H. Of the others, only J2 indicates an unambiguous recent external contribution, from West Asia rather than Central Asia. The current distributions of haplogroup frequencies are, with the exception of theO lineages, predominantly driven by geographical, rather than cultural determinants. Ironically, it is in the northeast of India, among the TB groups that there is clear-cut evidence for large-scale demic diffusion traceable by genes, culture, and language, but apparently not by agriculture.
      A Prehistory of Indian Y-Chromosomes: Evaluating Demic Diffusion Scenarios
      Sanghamitra Sahoo et al, 2006, The National Academy of Sciences of the USA
      • H, L, and R2 are the major Indian Y-chromosomal haplogroups that occur both in castes and in tribal populations and are rarely found outside the subcontinent. Haplogroup R1a, previously associated with the putative Indo-Aryan invasion, was found at its highest frequency in Punjab but also at a relatively high frequency (26%) in the Chenchu tribe.
      • Altogether, three clades—H, L, and R2—account for more than one- third of Indian Y chromosomes. They are also found in decreasing frequencies in central Asians to the north and in Middle Eastern populations to the west. Unclassified derivatives of the general Eurasian clade F were observed most frequently (27%) in the Koyas.
      • The presence of several subclusters of F and K (H, L, R2, and F*) that are largely restricted to the Indian subcontinent is consistent with the scenario that the coastal (southern route) migration(s) from Africa carried the ancestral Eurasian lineages first to the coast of Indian subcontinent (or that some of them originated there). Next, the reduction of this general package of three mtDNA (M, N, and R) and four Y-chromosomal (C, D, F, and K) founders to two mtDNA (N and R) and two Y-chromosomal (F and K) founders occurred during the westward migration to western Asia and Europe. After this initial settlement process, each continental region (including the Indian subcontinent) developed its region-specific branches of these founders, some of which (e.g., the western Asian HV and TJ lineages) have, via continuous or episodic low-level gene flow, reached back to India. Western Asia and Europe have thereafter received an additional wave of genes from Africa, likely via the Levantine corridor, bringing forth lineages of Y-chromosomal haplogroup E, for example (Underhill et al. 2001b), which is absent in India.
      • Given the geographic spread and STR diversities of sister clades R1 and R2, the latter of which is restricted to India, Pakistan, Iran, and southern central Asia, it is possible that southern and western Asia were the source for R1 and R1a differentiation. Compared with western Asian populations, Indians show lower STR diversities at the haplogroup J background (Quintana-Murci et al. 2001; Nebel et al. 2002) and virtually lack J*, which seems to have higher frequencies in the Middle East and East Africa (Eu10 [Ne- bel et al. 2001]; Ht25 [Semino et al. 2002]) and is common also in Europe (Underhill et al. 2001b). Therefore, J2 could have been introduced to northwestern India from a western Asian source relatively recently and, subsequently, after co-mingling in Punjab with R1a, spread to other parts of India, perhaps associated with the spread of the Neolithic and the development of the Indus Valley civilization. This spread could then have also taken with it mtDNA lineages of haplogroup U, which are more abundant in the northwest of India, and the western Eurasian lineages of haplogroups H, J, and T.
      • …..the occurrence of Y- chromosome haplogroups L, H, R2, and R1a in both caste and isolated tribal populations suggests much of the existing Indian population structure is very old. Additionally, the high diversity of Y haplogroups R1a1 and R2 in both South Indian and Indus valley populations has led to the suggestion that there is little, if any, genetic influence from other Eurasians on the castes of South India.
      • The antiquity and complex geographic distribution of the R1a1 and R2 haplogroups led these authors to conclude that the majority of the subcontinent Y-chromosomes arrived in or before the early Holocene (10,000 years ago) rather than in a later Indo-European expansion. Likewise, and concordant with other studies of tribal Indian populations, we observe Y-chromosome R1a1 lineages in South Indian tribal Irula (unpublished data), a population substantially differentiated from South Indian castes.
      • Yet, the occurrence of Y- chromosome haplogroups L, H, R2, and R1a in both caste and isolated tribal populations suggests much of the existing Indian population structure is very old. Additionally, the high diversity of Y haplogroups R1a1 and R2 in both South Indian and Indus valley populations has led to the suggestion that there is little, if any, genetic influence from other Eurasians on the castes of South India.
      • On the basis of the combined phylogeographic distributions of haplotypes observed among populations defined by social and linguistic criteria, candidate HGs that most plausibly arose in situ within the boundaries of present-day India include C5-M356, F*-M89, H-M69* (and its sub-clades H1-M52 and H2-APT), R2-M124, and L1-M76. The congruent geographic distribution of H-M69* and potentially paraphyletic F*-M89 Y chromosomes in India suggests that they might share a common demographic history.
      • The decreasing frequency of R2—from 7.4% in Pakistan to 3.8% in Central Asia (Wells et al. 2001) to 1% in Turkey (Cinnioglu et al. 2004)—is consistent with the pattern observed for the autochthonous Indian H1-M52 HG.
      • On the basis of a broad distribution—involving all social and linguistic categories in India—and relatively high diversification patterns, it can be concluded that representatives of HGs C5-M356 H-M69*, F*, L1, and R2 have ancestry indigenous to the Asian subcontinent.
      • In HGs R1a1 and R2, the associated mean microsatellite variance is highest in tribes, not castes. This is a clear contradiction of what would be expected from an explanation involving a model of recent occasional admixture. Beyond taking advantage of highly resolved phylogenetic hierarchy as just an efficient genotyping convenience, a comprehensive approach that leverages the phylogeography of Y-chromosome diversification by using a combination of HG diversification with geography and expansion-time estimates provides a more insightful and accurate perspective to the complex human history of South Asia.
      • When considered at the general HG level, L, R1a, and R2 all display approximate similarity with respect to population-category apportionment and frequency (Cordaux et al. 2004).
      • Although it would be convenient to assume that R1a1 and R2 representatives reflect a recent common demography (Cordaux et al. 2004), it is entirely plausible that they harbor as-yet-undiscovered subsequent haplogroup diversification that approximates the phylogeographic patterns revealed for HG L.
      • The phylogeography and the similarity of microsatellite variation of HGs R1a1 and R2 to L1-M76 in South Asian tribes argues that they likely share a common demographic history.
      • The distribution of HG R2-M124 is more circumscribed relative to R1a1, but it has been observed at informative levels in Central Asia, Turkey, Pakistan, and India. The distribution of R1a1 and R2 within India is similar, as are the levels of associated microsatellite variance. The ages of the Y-microsatellite variation for R1a1 and R2 in India suggest that the prehistoric context of these HGs will likely be complex.
      • .... there is no evidence whatsoever to conclude that Central Asia has been necessarily the recent donor and not the receptor of the R1a lineages. The current absence of additional informative binary subdivision within this HG obfuscates potential different histories hidden within this HG, making such interpretations as the sole and recent source area overly simplistic. The same can be said in respect to HG R2-M124.
      • The most frequent haplogroup among the Indian upper castes belongs to R lineages (R*, R1 and R2); together, these account for 44% of the upper caste Y-chromosomes. Haplogroup H was the most frequent Y lineage in both the lower castes and tribal populations, with frequencies of 0.25 and 0.30, respectively. The Indian Y-SNP tree (Figure 3) shows that the distribution pattern of the major Y lineages is similar in tribal and lower caste populations, and is distinct from the upper castes.
      • The sister clades; R1a1 (M17) and R2 (M124) of the M207 lineage together form the largest Y haplogroup lineage in India, with a frequency of 0.32. They are present in substantial frequencies throughout the subcontinent, irrespective of the regional and linguistic barriers. The haplogroup R-M17 also has a wide geographic distribution in Europe, West Asia and the Middle East, with highest frequencies in Eastern European populations [23]. It is proposed to be originated in the Eurasian Steppes, north of the Black and Caspian seas, in a population of the Kurgan culture known for the domestication of horse, ~3500 ybp [23], and widely been regarded as a marker for the male-mediated Indo-Aryan invasion of Indian subcontinent. However, these observations were contradicted by the higher STR variations observed in the Indian M17 and M124 samples, compared with the European and Central Asian populations, suggesting a much deeper time depth for the origin of the Indian M17 lineages. In the present study, it was observed that the R lineages were successfully penetrated to high frequencies (0.26) in the South Indian tribal populations, a testimony for its arrival in the peninsula much before the recent migrations of Indo-European pastoralists from Central Asia. In a recent study, Sengupta et al [24] observed higher microsatellite variance, and clustering together of Indian M17 lineages compared with the Middle East and Europe. They proposed that it is an early invasion of M17 during the Holocene expansion that contributed to the tribal gene pool in India, than a recent gene flow from Indo-European nomads. However, we found that its frequency is much higher in upper castes (0.44) compared to that of the lower caste (0.22) and tribal groups (0.26). This uneven distribution pattern shows that the recent immigrations from Central Asia also contributed undoubtedly to a pre-existing gene pool.
      • The presence of the so called west/central Asian lineages like J2, R1 and R2 in most of the endogamous tribal populations, and its higher STR diversity indicates its presence in the sub-continent much before the arrival of the Indo-European pastoralists. In short, the impact of their arrival in the Indian sub-continent is rather social and political, than genetic.
      • .....it was suggested that a package of Y-HGs (J2, R1a, R2 and L) was associated with the migration of Indo-European people from Central Asia.7 Although our study observed a high frequency of Y-HGs, R1a1, J*/J2, R2 and L, it was not exclusively restricted to any region or population (Table 1). Moreover, most of the population groups from the studied regions showed a less frequency of the highly frequent haplogroups of Central Asia: C3, DE, I, G, J*, N and O, except for some population-specific distributions.
      • The percentage distribution of haplogroups in Brahmins (n=256) showed a total of six most frequent (percentage >5%) haplogroups: R1a1* (40.63%), J2 (12.5%), R2 (8.59%), L (7.81%), H1 (6.25%) and R1* (5.47%), contributing to 81.25% of the total distribution in Brahmins. Tribals and scheduled castes (n=254) also showed six haplogroups: H1 (31.10%), R1a1* (20.47%), J2 (10.24%), L (7.87%), H* (7.87%) and O (6.69%), contributing in total to 84.25%.
      • All together (Brahmins, schedule castes and tribals), 22 Y-haplogroups were observed. The percentages of seven of these haplogroups (with percentage >5%) accounted for 85.5% of the total number of Y-chromosomes (n=2809). The haplogroups with their percentages in descending order were: R1a1* (21.1%), H1 (19.1%), R2 (10.5%), O (10.1%), L (9.5%), J*/J2 (8.3%) and F* (6.9%).
      • Five haplogroups out of 18 were found to be most frequent (>5%) in Brahmins (R1a1* (35.7%), J*/J2 (12.4%), L (11.3%), R2 (10.8%) and H1 (8.0%)) and represented 78.2% of the total number of samples (n =767), whereas haplogroup O was found to be very less frequent (0.7%) in Brahmin Y-chromosomes. Seven out of 14 haplogroups (with percentage >5%) (H1 (24.2%), R1a1* (17.2%), R2 (14.2%), L (12.2%), F* (9.8%), J*/J2 (6.4%) and K* (5.3%)) represented 89.3% of the total number of Dalit Y-chromosomes (n =674). Tribal Y-chromosomes represented by seven out of 20 haplogroups displayed percentages >5%: O (25.5%), H1 (25.3%), R1a1* (10.2%), F* (7.5%), R2 (6.4%), J*/J2 (6.1%) and L (5%) (86% of the total number of samples (n=1368)).
      Swarkar Sharma et al., “The Indian origin of paternal haplogroup R1a1* substantiates the autochthonous origin of Brahmins and the caste system,” J Hum Genet 54, no. 1 (January 9, 2009): 47-55.

      (Y Haplogroups and Aggressive Behavior in a Pakistani Ethnic Group)
      • Five Y haplogroups that are commonly found in Eurasia and Pakistan comprised 87% (n=136) of the population sample, with one haplogroup, R1a1, constituting 55% of the sampled population. A comparison of the total and four sub-scale mean scores across the five common Y haplogroups that were present at a frequency >=3% in this ethnic group revealed no overall significant differences. However, effect-size comparisons allowed us to detect an association of the haplogroups R2 (Cohen’s d statistic5.448–.732) and R1a1 (d5.107–.448) with lower self reported aggression mean scores in this population.
      • Mean scores were lowest for haplogroup R2 (58.83) and highest for J2a2 (74.60).
      • Using measures that are independent of sample size, we were able to detect an effect-size association of haplogroups R2 and R1a1, with lower mean scores indicating that the male-specific regions of the Y chromosome may contribute to self-reported human aggressive behavior. Both R1a1 and R2 share a common ancestor on the Y phylogenetic tree [Karafet et al., 2008] and membership in haplogroup R defined by the M207 mutation accounts for a small effect size (Cohen’s d statistic=.120) and 6% of the variance in the mean scores (r =241). This association of haplogroup R, which is a frequent haplogroup found in extant Indo-European populations, raises an intriguing possibility that behavior could have played a role in its evolutionary selection.
      S. Shoaib Shah et al., “Y haplogroups and aggressive behavior in a Pakistani ethnic group,” Aggressive Behavior 35, no. 1 (2009): 68-74.

      Saturday, February 13, 2010

      Thursday, February 11, 2010

      FTDNA's public yDNA haplogroup projects

      Projects  
      A ..................... http://www.familytreedna.com/public/Haplogroup_A/
      C ..................... http://www.familytreedna.com/public/Chaplogroup/
      E-M35 ................. http://www.familytreedna.com/public/E3b/
      F ..................... http://www.familytreedna.com/public/F-YDNA/
      G ..................... http://www.familytreedna.com/public/G-YDNA/
      G2c (formerly G5) ..... http://www.familytreedna.com/public/G2c/
      E1a  .................. http://www.familytreedna.com/public/HaplogroupE1andE/
      H ..................... http://www.familytreedna.com/public/YHaploGroupH/
      I1 .................... http://www.familytreedna.com/public/yDNA_I1/
      I2a ................... http://www.familytreedna.com/public/I2aHapGroup/
      I2b2-L38 .............. http://www.familytreedna.com/public/I2b2/
      I-M223 ................ http://www.familytreedna.com/public/M223-Y-Clan/
      I-P109 "I1c" .......... http://www.familytreedna.com/public/yDNA_I-P109/
      I ..................... http://www.familytreedna.com/public/Haplogroup%20I%20Y-DNA%20Project%20Web%20Site/
      J ..................... http://www.familytreedna.com/public/Y-DNA_J/
      J2 .................... http://www.familytreedna.com/public/J2%20Y%20DNA%20group/index.aspx/
      J2b_455-8 ............. http://tracingroots.nova.org/J2b_455-8.htm
      J2b-M102+ ............. http://www.familytreedna.com/public/m102/
      J2Plus ................ http://www.familytreedna.com/public/J2Plus/
      Jewish E3b ............ http://www.familytreedna.com/public/JewishE3bProject/
      Jewish Q .............. http://www.familytreedna.com/public/Jewish_Q/
      L ..................... http://www.familytreedna.com/public/Y-Haplogroup-L/
      N ..................... http://www.familytreedna.com/public/N%20Y-DNA%20Project/
      O...O3 ................ http://www.familytreedna.com/public/o3/
      Q3 American Indian .... http://www.familytreedna.com/public/Amerind%20Y/
      Q ..................... http://www.familytreedna.com/public/yDNA_Q/
      R* .................... http://www.familytreedna.com/public/Rasterisk/
      R1* ................... http://www.familytreedna.com/public/R1Asterisk/
      R1a Y-DNA Haplogroup .. http://www.familytreedna.com/public/R1aY-Haplogroup/
      R1b and Subclades ..... http://www.familytreedna.com/public/r1b/
      R1b (U152+) ........... http://www.familytreedna.com/public/R1b1c10/
      R1b Jewish ............ http://www.familytreedna.com/public/JewishR1b/
      R1b1* ................. http://www.familytreedna.com/public/R1b1Asterisk/
      R1b1b1 (aka R-M73) .... http://www.familytreedna.com/public/R1b1b1/
      R1b1b2a1b4 SRY2627+ ... http://www.familytreedna.com/public/R1b1c6/
      r1b1b2Asterisk ........ http://www.familytreedna.com/public/r1b1b2/
      R1b-U106 .............. http://www.familytreedna.com/public/U106/
      R1b-U198/S29+ ......... http://www.familytreedna.com/public/U198/
      R2 .................... http://www.familytreedna.com/public/R2/
      R-ht35 (P312- U106-) .. http://www.familytreedna.com/public/ht35new/
      R-L21Plus ............. http://www.familytreedna.com/public/R-L21/
      R-M153 ................ http://www.familytreedna.com/public/R-M153_The_Basque_Marker/
      R-M222 ................ http://www.familytreedna.com/public/R1b1c7/
      R-P312 and Subclades .. http://www.familytreedna.com/public/atlantic-r1b1c/
      T ..................... http://www.familytreedna.com/public/Y-Haplogroup-K2/
       
      Links to Join Projects (if you've tested with FTDNA)
      A ...................... https://www.familytreedna.com/group-join-request.aspx?group=AYDNA
      C ...................... https://www.familytreedna.com/group-join-request.aspx?group=C
      E-M35 .................. https://www.familytreedna.com/group-join-request.aspx?group=E-M35_Project
      F ...................... https://www.familytreedna.com/group-join-request.aspx?group=F-YDNA
      G ...................... https://www.familytreedna.com/group-join-request.aspx?group=G_Haplogroup
      G2c (formerly G5) ...... https://www.familytreedna.com/group-join-request.aspx?group=G2c
      E1a .................... https://www.familytreedna.com/group-join-request.aspx?group=HaplogroupE1a
      H ...................... https://www.familytreedna.com/group-join-request.aspx?group=H-YDNA
      I1 ..................... https://www.familytreedna.com/group-join-request.aspx?group=I1
      I2a .................... https://www.familytreedna.com/group-join-request.aspx?group=I2a
      I2b2-L38 ............... https://www.familytreedna.com/group-join-request.aspx?group=I-L38
      I-M223 ................. https://www.familytreedna.com/group-join-request.aspx?group=I2b
      I-P109 "I1c" ........... https://www.familytreedna.com/group-join-request.aspx?group=I1c
      I ...................... https://www.familytreedna.com/group-join-request.aspx?group=I-Y-DNA
      J ...................... https://www.familytreedna.com/group-join-request.aspx?group=J-Y-DNA
      J2 ..................... https://www.familytreedna.com/group-join-request.aspx?group=J2
      J2b_455-8 .............. https://www.familytreedna.com/group-join-request.aspx?group=J2b_455-8
      J2b-M102+ .............. https://www.familytreedna.com/group-join-request.aspx?group=M102plus
      J2Plus ................. https://www.familytreedna.com/group-join-request.aspx?group=J2Plus
      Jewish E3b ............. https://www.familytreedna.com/group-join-request.aspx?group=Jewish_E3b
      Jewish Q ............... https://www.familytreedna.com/group-join-request.aspx?group=Jewish_Q
      L ...................... https://www.familytreedna.com/group-join-request.aspx?group=L
      N ...................... https://www.familytreedna.com/group-join-request.aspx?group=N-YDNA
      O...O3 ................. https://www.familytreedna.com/group-join-request.aspx?group=O3
      Q3 American Indian ..... https://www.familytreedna.com/group-join-request.aspx?group=Q3_AmericanIndian
      Q ...................... https://www.familytreedna.com/group-join-request.aspx?group=Q-YDNA
      R* ..................... https://www.familytreedna.com/group-join-request.aspx?group=R*
      R1* .................... https://www.familytreedna.com/group-join-request.aspx?group=R1*
      R1a .................... https://www.familytreedna.com/group-join-request.aspx?group=R1a
      R1b and Subclades ...... https://www.familytreedna.com/group-join-request.aspx?group=R1b
      R1b (U152+) ............ https://www.familytreedna.com/group-join-request.aspx?group=R1b1c10
      R1b Jewish ............. https://www.familytreedna.com/group-join-request.aspx?group=R1b_Jewish
      R1b1* .................. https://www.familytreedna.com/group-join-request.aspx?group=R1b1Asterisk
      R1b1b1 (aka R-M73) ..... https://www.familytreedna.com/group-join-request.aspx?group=R1b1b
      R1b1b2a1b4 SRY2627+ .... https://www.familytreedna.com/group-join-request.aspx?group=R1b1c6
      r1b1b2Asterisk ......... https://www.familytreedna.com/group-join-request.aspx?group=r1b1b2Asterisk
      R1b-U106 ............... https://www.familytreedna.com/group-join-request.aspx?group=R1b-U106
      R1b-U198/S29+ .......... https://www.familytreedna.com/group-join-request.aspx?group=R1b1b2g1
      R2 ..................... https://www.familytreedna.com/group-join-request.aspx?group=R2
      R-ht35 (P312- U106-) ... https://www.familytreedna.com/group-join-request.aspx?group=ht35
      R-L21Plus .............. https://www.familytreedna.com/group-join-request.aspx?group=R-L21Plus
      R-M153 ................. https://www.familytreedna.com/group-join-request.aspx?group=R-M153
      R-M222 ................. https://www.familytreedna.com/group-join-request.aspx?group=R-M222
      R-P312 and Subclades ... https://www.familytreedna.com/group-join-request.aspx?group=R-P312_and_Subclades
      T (formerly K2) ........ https://www.familytreedna.com/group-join-request.aspx?group=K2-Male 

      Saturday, December 12, 2009

      Asia populated in one migratory swoop

      By David Cyranoski

      Researchers mapping a massive array of genomes across Asia say they have found evidence that humans covered the continent in a single migratory wave, and share a common ancestry.

      The findings were released by the Human Genome Organisation (HUGO) Pan-Asian SNP Consortium which looks at single-nucleotide polymorphisms (SNPs), or variations at individual bases that make up the genetic code. The results challenge the view that Asia was populated by at least two waves of migration.

      "In Asia, we are all related," says Edison Liu, a lead author from the Genome Institute of Singapore. "It brings us closer together."

      It is thought that a wave of humans emerged from Africa some 60,000-75,000 years ago and travelled along the southern coast of India, into southeast Asia and down to Oceania. But scientists struggled to explain some of the variation seen in Asia today - such as the obvious physical differences between Malaysian and Filipino Negrito populations and other Asians. Some researchers have postulated that a second wave, or series of waves, from a northern route largely repopulated the area, leaving the Negrito and others as relicts of the earlier migration.

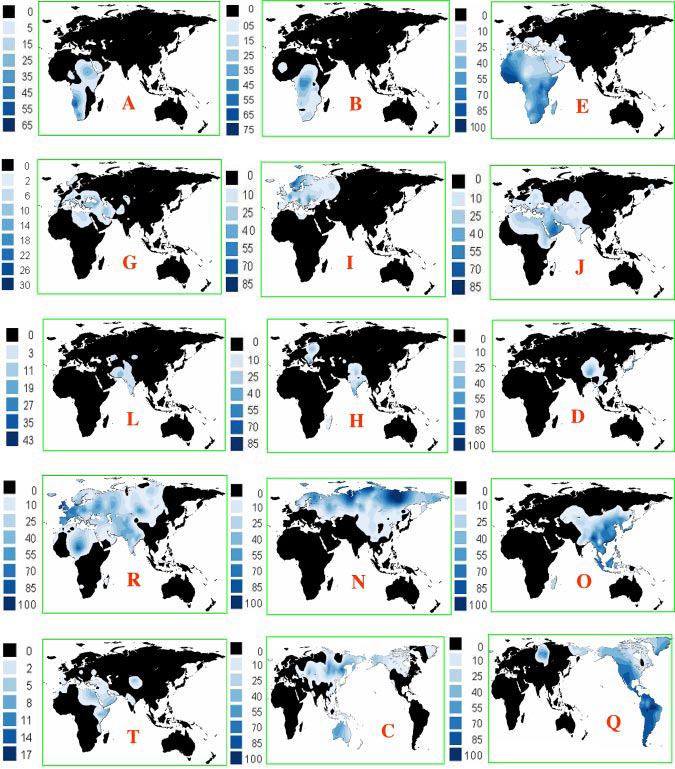
      The new study, a five-year examination of variation at some 55,000 SNPs in 1928 individuals, found that Negrito populations had a high level of genetic overlap with other southeast Asia populations, suggesting a common ancestry. East Asians, the analysis suggests, share a large degree of common genetic background with southeast Asians but very little with central Asians, seeming to preclude a peopling of east Asia through a northern route via the Eurasian Steppes. And genetic variation within local populations decreased from southeast to northeast Asia. The two observations suggest that diverse peoples living in southeast Asia migrated northwards.

      "It's an impressive collection of samples, a huge amount of work and analysis, and it will contribute greatly to the field," says Mark Stoneking, an evolutionary geneticist at Max Planck Institute for Evolutionary Anthropology in Leipzig, Germany, who was not involved in the study.

      Asian unity

      Merely organizing the work was a massive task. Researchers in 11 countries and regions took samples from 73 populations, requiring countries often at political or economic loggerheads to share ideas, technology and genomes. For countries lacking the technological capabilities to do the genetic analysis but loath to ship genetic samples to another country, Liu established a system by which researchers could bring the samples to host countries and do the studies themselves, in collaboration with their hosts. "The chain of custody was never broken," he says. "It was extraordinarily collegial."

      The result is not a complete shock. While this study provides the most detailed analysis of genetic diversity among Asians to date, a 2005 study on mitochondrial DNA came to a similar conclusion2. Martin Richards, at the University of Leeds, UK, is a specialist in genetic variation in southeast Asia who led that study. "By and large, [the new study] is not surprising for fans of mitochondrial DNA, I think, but naturally it is very heart-warming," he says.

      The new study also supports mitochondrial DNA evidence that challenges the customary "out of Taiwan" model, in which migration from mainland China through Taiwan led to the settlement of southeast Asia and the Pacific islands. Instead it seems Taiwan may have been largely settled from islands in southeast Asia.

      But the results are not conclusive, as the authors admit. Stoneking says he was "very surprised that the Negrito populations were not more genetically distinct", and would like to see other supposed relict populations, such as those in New Guinea and Australia, studied in the same kind of detail. He argues that it is not possible to tell whether extensive genetic intermingling with surrounding populations might have obscured evidence for two waves of migration. He says he has evidence to support the two-wave theory in work yet to be published that looks specifically at mitochondrial DNA and Y-chromosomes of Negrito populations.

      Liu says he is discussing plans for a second phase study with much higher resolution - based on 600,000-1 million SNPs. Possible extensions for the new project will be a look at copy number variation (duplications in sections of DNA), a resequencing of mitochondrial DNA and a focus on specific genetic components such as differences between enzymes that metabolize drugs, and human leukocyte antigen variations. It will be especially tantalizing, says Liu, to see if drug-metabolism genes show the same north-south variation in east Asia. "There would be implications for drug response and clinical trials," he says - although he adds that it will not be possible to link specific health information to genotypes across the continent.

      Asia populated in one migratory swoop - SciAm
      http://www.sciencemag.org/cgi/content/abstract/326/5959/1541
       

      Friday, November 20, 2009

      Y chromosome diversity, human expansion, drift, and cultural evolution

      Jacques Chiaroni,
      Peter A. Underhill and
      Luca L. Cavalli-Sforza
      17 Nov, 2009

      Abstract:

      The relative importance of the roles of adaptation and chance in determining genetic diversity and evolution has received attention in the last 50 years, but our understanding is still incomplete. All statements about the relative effects of evolutionary factors, especially drift, need confirmation by strong demographic observations, some of which are easier to obtain in a species like ours. Earlier quantitative studies on a variety of data have shown that the amount of genetic differentiation in living human populations indicates that the role of positive (or directional) selection is modest. We observe geographic peculiarities with some Y chromosome mutants, most probably due to a drift-related phenomenon called the surfing effect. We also compare the overall genetic diversity in Y chromosome DNA data with that of other chromosomes and their expectations under drift and natural selection, as well as the rate of fall of diversity within populations known as the serial founder effect during the recent “Out of Africa” expansion of modern humans to the whole world. All these observations are difficult to explain without accepting a major relative role for drift in the course of human expansions. The increasing role of human creativity and the fast diffusion of inventions seem to have favored cultural solutions for many of the problems encountered in the expansion. We suggest that cultural evolution has been subrogating biologic evolution in providing natural selection advantages and reducing our dependence on genetic mutations, especially in the last phase of transition from food collection to food production.


      Y chromosome haplogroup geographical distribution map
       
       
      Phylogenetic relationships of the 20 major Y chromosome haplogroups


      Haplogroup R and subclades frequency distribution


      Link

      Wednesday, November 4, 2009

      New study on Haplogroup R1a

      This study speaks against substantial gene flow from Eastern Europe since the mid holocene(1000 to 3000 years earlier than the purported time of the mythical Aryan Invasion of India):

      "the virtual absence of M458 chromosomes outside Europe speaks against substantial patrilineal gene flow from East Europe to Asia, including to India, at least since the mid-Holocene. "

      Separating the post-Glacial coancestry of European and Asian Y chromosomes within haplogroup R1a

      Underhill et al. - Nov 2009

      Abstract:

      Human Y-chromosome haplogroup structure is largely circumscribed by continental boundaries. One notable exception to this general pattern is the young haplogroup R1a that exhibits post-Glacial coalescent times and relates the paternal ancestry of more than 10% of men in a wide geographic area extending from South Asia to Central East Europe and South Siberia. Its origin and dispersal patterns are poorly understood as no marker has yet been described that would distinguish European R1a chromosomes from Asian. Here we present frequency and haplotype diversity estimates for more than 2000 R1a chromosomes assessed for several newly discovered SNP markers that introduce the onset of informative R1a subdivisions by geography. Marker M434 has a low frequency and a late origin in West Asia bearing witness to recent gene flow over the Arabian Sea. Conversely, marker M458 has a significant frequency in Europe, exceeding 30% in its core area in Eastern Europe and comprising up to 70% of all M17 chromosomes present there. The diversity and frequency profiles of M458 suggest its origin during the early Holocene and a subsequent expansion likely related to a number of prehistoric cultural developments in the region. Its primary frequency and diversity distribution correlates well with some of the major Central and East European river basins where settled farming was established before its spread further eastward. Importantly, the virtual absence of M458 chromosomes outside Europe speaks against substantial patrilineal gene flow from East Europe to Asia, including to India, at least since the mid-Holocene.

      Link

      Genographic Project Censorship

      Got home last night, switched on my computer, went through my email and later on logged onto Facebook to check out who's 'poking' who. I happen to be a 'fan' of the Genographic Project on Facebook and noticed a post by them about a museum exhibit at the  San Diego Museum of Man that's being set up. I have a special interest in the Genographic Project since I had a DNA test done through the organization.

      The Genographic Project tests your DNA for a fee and sends you a report on your 'deep ancestry' based on which Haplogroup you belong to. I'm sure that my DNA results from them were accurate enough, but the report that accompanied my results is based purely on speculation and unproven hypotheses of human migration. For instance, the 'story' of Haplogroup R(I belong to a 'sub-clade' of haplogroup R) is modelled to fit with the Aryan Invasion Theory - a racist 19th century colonial theory with no scientific backing. After doing further research I realised that their reports are highly biased towards a Eurocentric view of human history.

      A couple of months ago the Genographic Project aired a program called 'The Human Family Tree'. In this program they sampled the DNA of random people of different ethnicities in the neighborhood of Queens, New York. Of course, their politically correct motto was that we all came from Africa in the very distant past, but I noticed that racial stereotypes were being used to portray people of different ethnicities. A Pakistani taxi driver, Thai waitress and restaurant owner, a Black body builder and a Greek(European) mayor of that neighborhood in Queens were a few of the subjects in that show. If that is not stereotyping then what is?

      I posted a comment on their Facebook fan page about their incorrect portrayal of racial stereotypes on that show and mentioned that Spencer Wells(director of the Genographic Project) should just stick to his job as a geneticist and refrain from racial stereotyping. The comment was promptly removed even though it was not in the least bit offensive to anyone.

      Friday, October 30, 2009

      The Cradle that is India - Subhash Kak

      Ideas about early Indian history continue to play an important role in political ideology of contemporary India. On the one side are the Left and Dravidian parties, which believe that invading Aryans from the northwest pushed the Dravidians to south India and India's caste divisions are a consequence of that encounter. Even the development of Hinduism is seen through this anthropological lens. This view is essentially that of colonial historians which was developed over a hundred years ago.


      On the other side are the nationalist parties, which believe that the Aryan languages are native to India. These groups cite the early astronomical dates in the Vedas, noting these texts are rooted firmly in the Indian geographical region. But Leftist scholars consider such evidence suspect, politically motivated, and chauvinistic.
      In recent years, the work of archaeologists and historians of science concluded that there is no material evidence for any large scale migrations into India over the period of 4500 to 800 BC, implicitly supporting the traditional view of Indian history. The Left has responded by conceding that there were probably no invasions; rather, there were many small scale migrations by Aryans who, through a process of cultural dominance, imposed their language on north Indians.


      The drama of text-book revisions, both during the NDA and the current UPA governments, is essentially a struggle to impose one or the other of these viewpoints. In any other country, such a fight would have fought in the pages of academic journals; but in India, where the government decides what history is, it is a political matter.


      Now, in an important book titled The Real Eve: Modern Man's Journey out of Africa (New York: Carroll and Graf Publishers, 2003), the prominent Oxford University scholar Stephen Oppenheimer has synthesised the available genetic evidence together with climatology and archaeology with conclusions which have bearing on the debate about the early population of India. This work has received great attention in the West, and it will also interest Indians tremendously.


      Much of Oppenheimer's theory is based on recent advances in studies of mitochondrial DNA, inherited through the mother, and Y chromosomes, inherited by males from the father. Oppenheimer makes the case that whereas Africa is the cradle of all mankind; India is the cradle of all non-African peoples. Man left Africa approximately 90,000 years ago, heading east along the Indian Ocean, and established settlements in India. It was only during a break in glacial activity 50,000 years ago, when deserts turned into grasslands, that people left India and headed northwest into the Russian steppes and on into Eastern Europe, as well as northeast through China and over the now submerged Bering Strait into the Americas.


      In their migration to India, African people carried the mitochondrial DNA strain L3 and Y chromosome line M168 across south Red Sea across the southern part of the Arabian Peninsula. On the maternal side the mtDNA strain L3 split into two daughters which Oppenheimer labels Nasreen and Manju. While Manju was definitely born in India the birthplace of Nasreen is tentatively placed by him in southern Iran or Baluchistan. One Indian Manju subclan in India is as old as 73,000 years, whereas European man goes back to less than 50,000 years.
      Considering the paternal side, Oppenheimer sees M168 as having three sons, of whom Seth was the most important one. Seth, in turn, had five sons which are named by him as Jahangir, H, I, G and Krishna. Krishna, born in India, is the ancestor of the peoples of East Asia, Central Asia, Oceania and West Eurasia (through the M17 mutation). This is what Oppenheimer says about M17:

      South Asia is logically the ultimate origin of M17 and his ancestors; and sure enough we find highest rates and greatest diversity of the M17 line in Pakistan, India, and eastern Iran, and low rates in the Caucasus. M17 is not only more diverse in South Asia than in Central Asia but diversity characterizes its presence in isolated tribal groups in the south, thus undermining any theory of M17 as a marker of a 'male Aryan Invasion of India.'

      Study of the geographical distribution and the diversity of genetic branches and stems again suggests that Ruslan, along with his son M17, arose early in South Asia, somewhere near India, and subsequently spread not only south-east to Australia but also north, directly to Central Asia, before splitting east and west into Europe and East Asia.


      Oppenheimer argues that the Eurocentric view of ancient history is also incorrect. For example, Europeans didn't invent art, because the Australian aborigines developed their own unique artistic culture in complete isolation. Indian rock art is also extremely ancient, going back to over 40,000 BC, so perhaps art as a part of culture had arisen in Africa itself. Similarly, agriculture didn't arise in the Fertile Crescent; Southeast Asia had already domesticated many plants by that time.


      Oppenheimer concludes with two extraordinary conclusions: 'First, that the Europeans' genetic homeland was originally in South Asia in the Pakistan/Gulf region over 50,000 years ago; and second, that the Europeans' ancestors followed at least two widely separated routes to arrive, ultimately, in the same cold but rich garden. The earliest of these routes was the Fertile Crescent. The second early route from South Asia to Europe may have been up the Indus into Kashmir and on to Central Asia, where perhaps more than 40,000 years ago hunters first started bringing down game as large as mammoths.'


      This synthesis of genetic evidence makes it possible to understand the divide between the north and the south Indian languages. It appears that the Dravidian languages are more ancient, and the Aryan languages evolved in India over thousands of years before migrations took them to central Asia and westward to Europe. The proto-Dravidian languages had also, through the ocean route, reached northeast Asia, explaining the connections between the Dravidian family and the Korean and the Japanese.


      Perhaps this new understanding will encourage Indian politicians to get away from the polemics of who the original inhabitants of India are, since that should not matter one way or the other in the governance of the country. Indian politics has long been plagued by the Aryan invasion narrative, which was created by English scholars of the 19th century; it is fitting that another Englishman, Stephen Oppenheimer, should announce its demise.


      (Link)

      Thursday, October 29, 2009

      More Aryan Invasion Rubbish

      I came across some typical crap coming from an American newspaper about the Aryan invasion through my RSS feed today(newsfeed, not the political party). A 1999 article was quoted to start off yet another pointless debate on the Aryan Invasion Theory on a forum. The signature of the person who started this topic says a lot about the mentality of people who buy into the Aryan Invasion Theory-  "Let's keep America beautiful by getting rid of niggers, spics, kikes, queers, and feminists!"


      Defenders of the theory conveniently forget that haplogroup R1a1, which is most often associated with the Aryan Invasion, is prevalent amongst tribes as well as lower castes of India in very high frequencies and not restricted to the upper castes by any means. The age,diversity, variance and frequency of R1a is highest in South Asia - with the age and variance amongst tribals being higher than in upper castes, almost proving that the origin of Y-DNA haplogroup R1a1 is RIGHT HERE IN INDIA. The direct correlation of haplogroup R1a1 and R2(high/low freq and variance in the same areas across the country) further suggests that they cohabited throughout, and coincidence can almost be ruled out (R2 is exceedingly rare, whereas R1a1 is present in high frequencies in Europe). Indian society evolved from tribal groups over millennia. I won't even get into the fact that there is absolutely no archaeological evidence of any kind of invasion at the time the so called white Aryans "took the women and set up the caste system in India". Since '99 however, the Aryan Invasion Theory has almost totally lost ground due to research in many fields, including genetics. The current trend is to manipulate and model studies on Indo-European languages to suit arrogant western beliefs that 'Proto-Indo-European', the supposed precursor of all IE languages, originated in Europe or Central Asia. South Asia is always totally sidelined in these western studies even though it is a known fact that Sanskrit is still the most advanced language on earth and is still used in India. Why the obsession with Central Asia being the homeland of mankind outside Africa and the Middle East? It's was and still is quite an inhospitable place whereas South Asia was and is a country rich in resources - perfect for human habitation.

      Aryan Invasion Theory supporters are alive and kicking till this day, flogging this dead horse regardless of countless studies disproving the theory. Many Indians themselves subscribe to AIT, maybe they love the idea of being partly European(it's common knowledge that most Indians look up to whites and white skin), however distant and  despite present day racist European supporters of this theory referring to ALL Indians as mongrels and half breeds who are literally 'bastards' - descendants of rape victims of the white invaders - not just North Indian 'Aryans'. All I can say is that I feel sorry for the low self esteem of these Indians. There are also many South Indians who love to support this theory because of their age old hatred of North Indians and possible inferiority complex due to their generally darker skin color(check out 'fair and lovely' sales in the south). The Brits also inferred that  since North Indian 'Aryans' are outsiders that stole the land and enslaved the local 'Dravidians' besides pushing them down south, they have every right to do the same. Also, after the discovery of the Indus Valley Civilization, the very same proponents of the Aryan Invasion Theory(AIT) had to change their story overnight from the Aryans being a noble and intelligent lot, to them being savages that destroyed the Indus Valley Civilization(IVC), LATER settling down and writing the Vedas and inventing Sanskrit. Oh yes, and of course they quickly added that the IVC was 'Dravidian' - thereby giving South Indians yet another reason to hate the North.


      It's time Indians woke up and realize that this is just a very outdated, racist and divisive idea instilled till this day in the minds of the gullible. In fact it is still being taught in schools all over India as fact, when it was always just a THEORY. AIT is a sham. Both South Indians, who believe they have been victimized by the North, and North Indians who believe they are superior due to alleged white European ancestry are losers at the end of the day. Neither of these things are true.  It's only the racist white man that will have the last laugh if Indians go on being deluded and continue being subservient to the west, buying hook line and sinker any horseshit that is fed to them.

      Thursday, October 8, 2009

      Traces of sub-Saharan and Middle Eastern lineages in Indian Muslim populations

      Abstract:
      Islam is the second most practiced religion in India, next to Hinduism. It is still unclear whether the spread of Islam in India has been only a cultural transformation or is associated with detectable levels of gene flow. To estimate the contribution of West Asian and Arabian admixture to Indian Muslims, we assessed genetic variation in mtDNA, Y-chromosomal and LCT/MCM6 markers in 472, 431 and 476 samples, respectively, representing six Muslim communities from different geographical regions of India. We found that most of the Indian Muslim populations received their major genetic input from geographically close non-Muslim populations. However, low levels of likely sub-Saharan African, Arabian and West Asian admixture were also observed among Indian Muslims in the form of L0a2a2 mtDNA and E1b1b1a and J*(xJ2) Y-chromosomal lineages. The distinction between Iranian and Arabian sources was difficult to make with mtDNA and the Y chromosome, as the estimates were highly correlated because of similar gene pool compositions in the sources. In contrast, the LCT/MCM6 locus, which shows a clear distinction between the two sources, enabled us to rule out significant gene flow from Arabia. Overall, our results support a model according to which the spread of Islam in India was predominantly cultural conversion associated with minor but still detectable levels of gene flow from outside, primarily from Iran and Central Asia, rather than directly from the Arabian Peninsula.

       New Paper from the European Journal of Human Genetics(link)

      Tuesday, October 6, 2009

      Sanskrit and Lithuanian

      One of the most important stimuli for the emergence of historical-comparative linguistics was the acquaintance of Europeans with Sanskrit, the old language of India. Europeans believed that a Sanskrit scholar could understand and be understood by a Lithuanian farmer.

      In 1786, William Jones (1746-1794), an English Justice of the Supreme Court of Judicature in Calcutta, read a paper before the Asiatic Society, founded by himself, in which he proclaimed that Sanskrit, this "wonderfully structured old language of India" is derived from the same source as Greek, Latin, and perhaps even Gothic and Celtic. This was a very bold idea, which produced a veritable revolution in linguistics.

      European scholars turned their attention to Sanskrit, and started with old European languages. They created precise methodology which enabled them to understand phonetic changes and distinguish original words from loans. They taught themselves through the comparison of related words in different languages to reconstruct the extinct forms, which were very often similar or even identical with Sanskrit forms.

      Linguists believed that comparative linguistics without Sanskrit is like astronomy without mathematics.

      It is not difficult therefore to imagine the surprise of the scholarly world when they learned that even in their time somewhere on the Nemunas River lived a people who spoke a language as archaic in many of its forms as Sanskrit itself. Although it was not exactly true that a professor of Sanskrit could talk to Lithuanian farmers in their language, coincidences between these two languages were truly amazing, for example:

      Sanskrit sunus son - Lith. sunus;
      Sanskrit viras man - Lith. vyras;
      Sanskrit avis sheep - Lith. avis;
      Sanskrit dhumas smoke - Lith. dumas;
      Sanskrit padas sole - Lith. padas.

      We can be safe in asserting that these Lithuanian words have not changed their forms for the last five thousand years.

      The most prominent European linguists visited Lithuania in order to learn this archaic language from the lips of Lithuanians themselves, which helped them investigate the history of other Indo-European languages.

      Today, there is no doubt that Lithuanian has retained many ancient Indo-European forms. It is hard to say whether it was due to the character of the Lithuanians or of geographic position that their language has changed so little in the course of several thousand years. Scholars often make references to the Lithuanian language when conducting research on the history of other languages.


      From "Lithuania in the World", 1996 No1.

      Lithuanian words similar or exact to Sanskrit

      • Lithuanian du/dvi, Sanskrit dvi/dve, Greek duo/dwo/tyu, Latin duo ("two")
      • Lithuanian trys, Sanskrit tri/traya, Greek trios/tria/treis, Latin tres ("three")
      • Lithuanian penki(os), Sanskrit páñcan, Greek pente/pende(cis) ("five")
      • Lithuanian šeši(os), Sanskrit sas, Greek heks/hecs/hex, Latin secs/sex ("six")
      • Lithuanian septyni(os), Sanskrit saptahn/sapta, Greek hepta(cis)/septa, Latin septem ("seven")
      • Lithuanian aštuoni(os), Sanskrit ashtan/ashta, Greek akto/okto/oktu(cis), Latin octo ("eight")
      • Lithuanian dešimt(is), Sanskrit dasham, Greek deka/deca(cis), Latin deci/decem ("ten")
      • Lithuanian žiema, Sanskrit hima ("winter")
      • Lithuanian derva/darva, Sanskrit druma/taru ("tree")
      • Lithuanian vilkas, Sanskrit vrika ("wolf")

      • Lith. and Skt. sūnus (son)
      • Lith. and Skt. avis and Lat. ovis (sheep)
      • Lith. dūmas and Skt. dhumas and Lat. fumus (smoke)
      • Lith. antras and Skt. antaras (second, the other)
      • Lith. vilkas and Skt. vrkas and Lat. lupus (wolf)
      • Lith. ratas and Lat. rota (wheel) and Skt. rathah (carriage).
      • Lith. senis and Lat. senex (an old man) and Skt. sanah (old).
      • Lith. vyras and Lat. vir (a man) and Skt. vira (man, hero).
      • Lith. angis and Lat. anguis (a snake in Latin, a species of snakes in Lithuanian)
      • Lith. linas and Lat. linum (flax, compare with English 'linen')
      • Lith. ariu and Lat. aro (I plow)
      • Lith. jungiu and Lat. iungeo (I join)
      • Lith. gentys and Lat. gentes (tribes) and Skt. jánas (genus, race).
      • Lith. mėnesis and Lat. mensis and Skt masa (month)
      • Lith. dantys and Lat. dentes and Skt dantas (teeth)
      • Lith. naktys and Lat. noctes and Skt. nakt (night)
      • Lith. sėdime and Lat. sedemus (we sit) and Skt. siedati (sits).

      Friday, September 25, 2009

      New paper on Indian Population History - "No Truth to the Aryan-Dravidian Theory"

      For the last couple of days many euro-centric bloggers assumed this study 'proves' that North Indians came from Europe via the alleged Aryan Invasion a few thousand years ago. Check out Dienekes blog for instance. Well, co-authors of the study say something else:

      Times of India
      http://timesofindia.indiatimes.com/news/india/Aryan-Dravidian-divide-a-myth-Study/articleshow/5053274.cms
      HYDERABAD: The great Indian divide along north-south lines now stands blurred. A pathbreaking study by Harvard and indigenous researchers on

      ancestral Indian populations says there is a genetic relationship between all Indians and more importantly, the hitherto believed ``fact'' that Aryans and Dravidians signify the ancestry of north and south Indians might after all, be a myth.

      ``This paper rewrites history... there is no north-south divide,'' Lalji Singh, former director of the Centre for Cellular and Molecular Biology (CCMB) and a co-author of the study, said at a press conference here on Thursday.

      Senior CCMB scientist Kumarasamy Thangarajan said there was no truth to the Aryan-Dravidian theory as they came hundreds or thousands of years after the ancestral north and south Indians had settled in India.

      The study analysed 500,000 genetic markers across the genomes of 132 individuals from 25 diverse groups from 13 states. All the individuals were from six-language families and traditionally ``upper'' and ``lower'' castes and tribal groups. ``The genetics proves that castes grew directly out of tribe-like organizations during the formation of the Indian society,'' the study said. Thangarajan noted that it was impossible to distinguish between castes and tribes since their genetics proved they were not systematically different.

      The study was conducted by CCMB scientists in collaboration with researchers at Harvard Medical School,
      Harvard School of Public Health and the Broad Institute of Harvard and MIT. It reveals that the present-day Indian population is a mix of ancient north and south bearing the genomic contributions from two distinct ancestral populations - the Ancestral North Indian (ANI) and the Ancestral South Indian (ASI).

      ``The initial settlement took place 65,000 years ago in the Andamans and in ancient south India around the same time, which led to population growth in this part,'' said Thangarajan. He added, ``At a later stage, 40,000 years ago, the ancient north Indians emerged which in turn led to rise in numbers here. But at some point of time, the ancient north and the ancient south mixed, giving birth to a different set of population. And that is the population which exists now and there is a genetic relationship between the population within India.''

      The study also helps understand why the incidence of genetic diseases among Indians is different from the rest of the world. Singh said that 70% of Indians were burdened with genetic disorders and the study could help answer why certain conditions restricted themselves to one population. For instance, breast cancer among Parsi women, motor neuron diseases among residents of Tirupati and Chittoor, or sickle cell anaemia among certain tribes in central India and the North-East can now be understood better, said researchers.

      The researchers, who are now keen on exploring whether Eurasians descended from ANI, find in their study that ANIs are related to western Eurasians, while the ASIs do not share any similarity with any other population across the world. However, researchers said there was no scientific proof of whether Indians went to Europe first or the other way round.

      Migratory route of Africans

      Between 135,000 and 75,000 years ago, the East-African droughts shrunk the water volume of the lake Malawi by at least 95%, causing migration out of Africa. Which route did they take? Researchers say their study of the tribes of Andaman and Nicobar islands using complete mitochondrial DNA sequences and its comparison those of world populations has led to the theory of a ``southern coastal route'' of migration from East Africa through India.

      This finding is against the prevailing view of a northern route of migration via Middle East, Europe, south-east Asia, Australia and then to India.


      I guess that as time goes by Aryan Invasion theorists will whittle down their 'theory' to "White Caucasian  Horse Riding  Proto-Indo-European Language Teacher That Digs Black Indian Aboroginal Chicks Changes The Indian Genetic Landscape Theory". :)